STEP 6
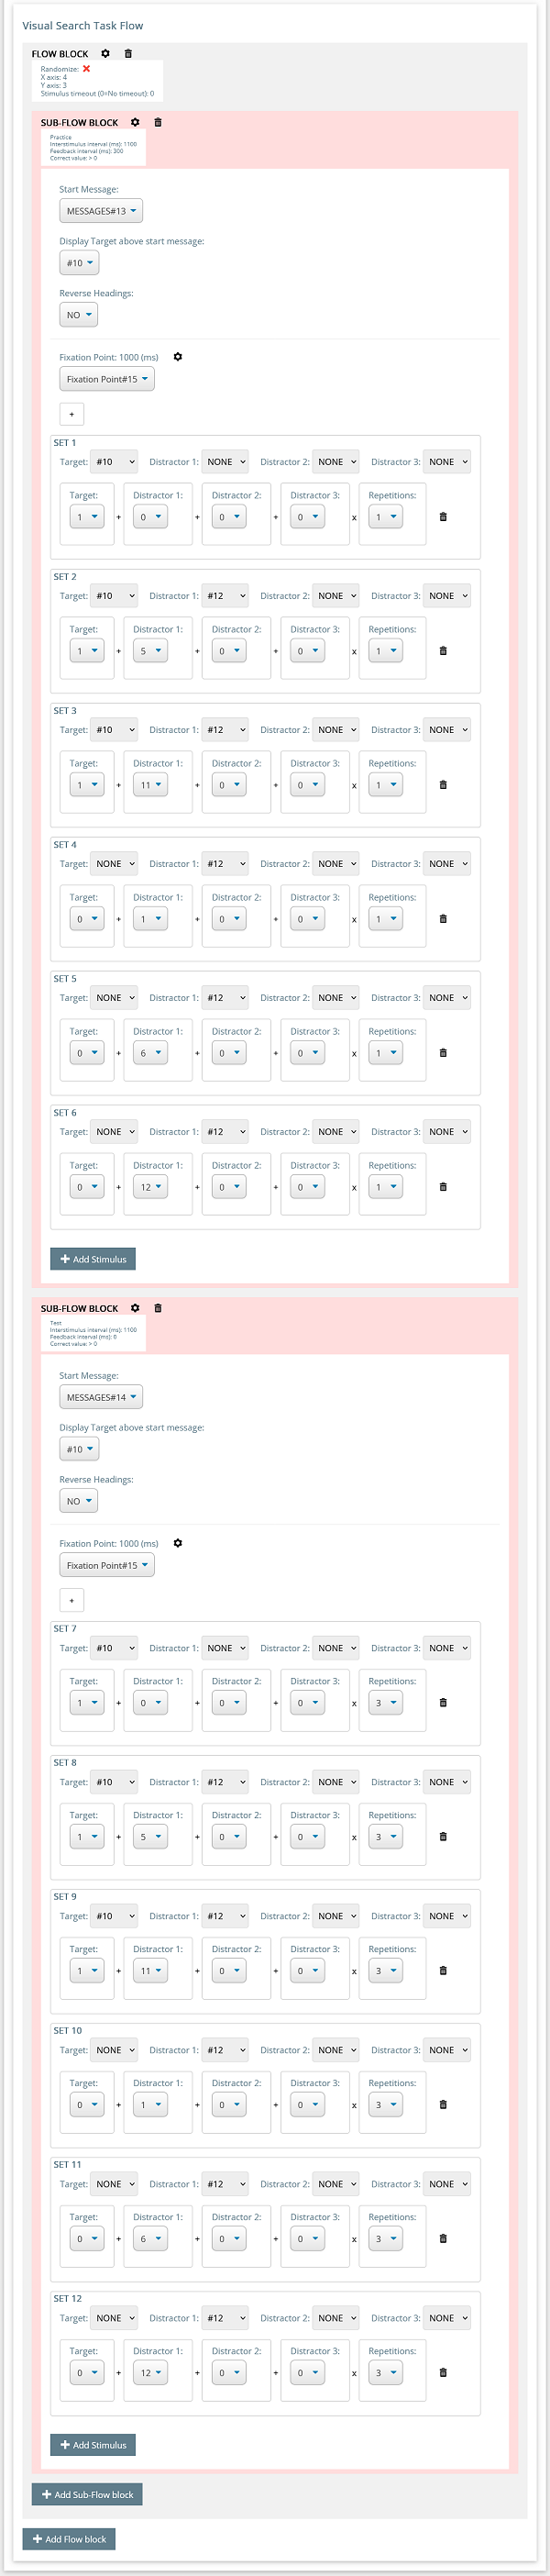
Now we will look at the flow of the Visual Search Task. The flow comprises of Flow blocks and sub-flow blocks. The sub-flow blocks within a flow block can be randomized by clicking the Flow Block settings (cog) icon
You can add as many blocks or sub-flow blocks as you wish to create your desired experiment.
The sub-flow block contains the following components.
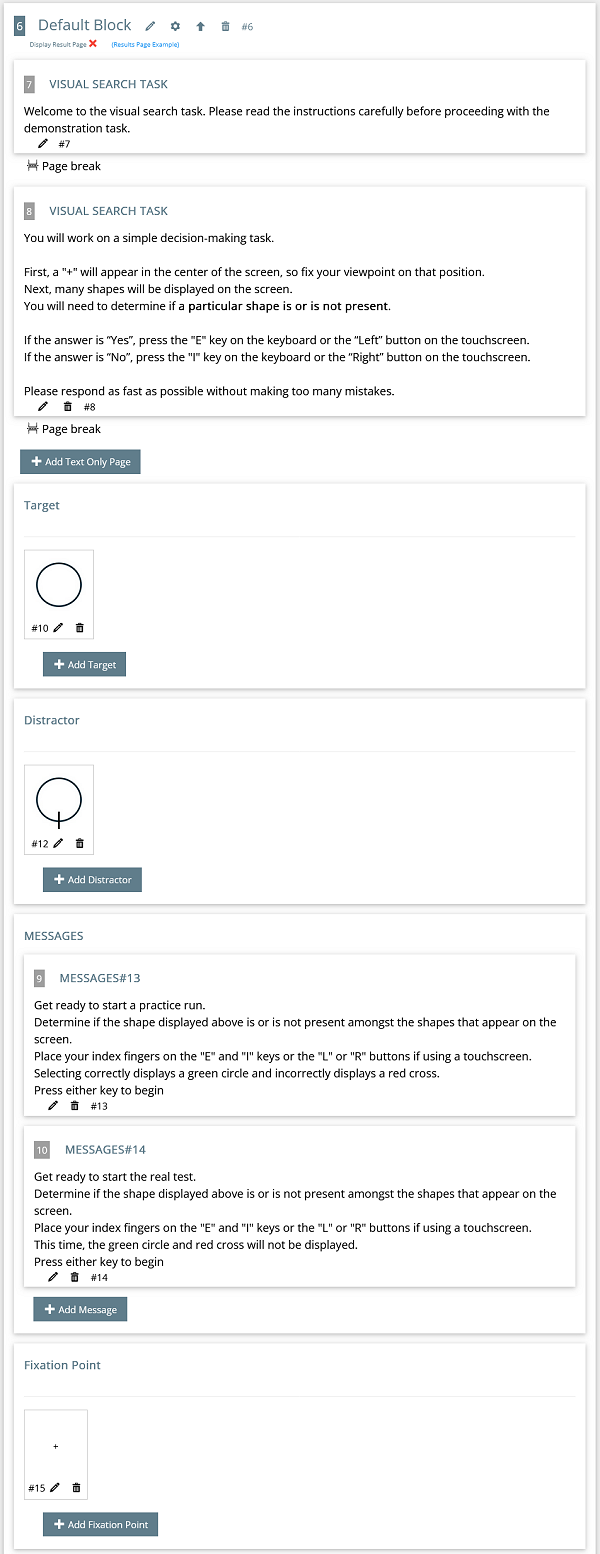
- Start Message: The start message is shown prior to the group of trials set in this sub-flow block. (optional)
- Display Target above start message: The target you select from the dropdown menu will be displayed above the start message. Caution: If the target you select is not being used in any of the sets within this sub-flow block, the experiment will break.
- Reverse Headings: Setting this to yes will put the Left Target Name on the right hand side and the Right Target Name on the left hand side. (The left and right target names are set in the experiment block which is at the very top of the experiment)
- Fixation Point: Set the number of milliseconds to display by clicking the settings (cog) icon.
- Multiple sets: The contents of each set is explained in detail below.
Each set contains the following components.
- Target: Set the target #id and the number of targets to include in the set from the two dropdowns.
- Distractor: You can set up to 3 types of distractors in the same set. Set the distractor #id and the number of distractors to include in the set from the six dropdowns.
If the total of all targets and distractors selected in one set is greater than the X and Y axis grid, the set will display red and the experiment will break. (example: X axis = 3, Y axis = 4, Grid Total = 12. Number of Targets set = 1, Distractors set = 12, Total = 13)
If a target or distractor #id is selected but the number is set to zero, the set will display yellow and the experiment will break. The same will happen if the reverse is set (#id = None, but a number other than zero is selected)
By clicking the sub-flow block settings (cog) icon, you can change the following settings.
- Practice: Unchecking this box will make the sets displayed in this sub-flow block a test. The average response time for test sets only are included in the dataset.
- Interstimulus interval (ms): This is the number of millseconds a blank interval is displayed prior to each fixation point being displayed.
- Feedback interval (ms): The feedback interval sets the length of time a red cross or green circle is displayed to let the respondent know if they got the answer correct or not. Setting this to zero will stop any feedback from being displayed.
- Correct value: This value is used to calculate a correct or incorrect answer. (Possible combinations: > N, >= N, < N, <= N, = N)
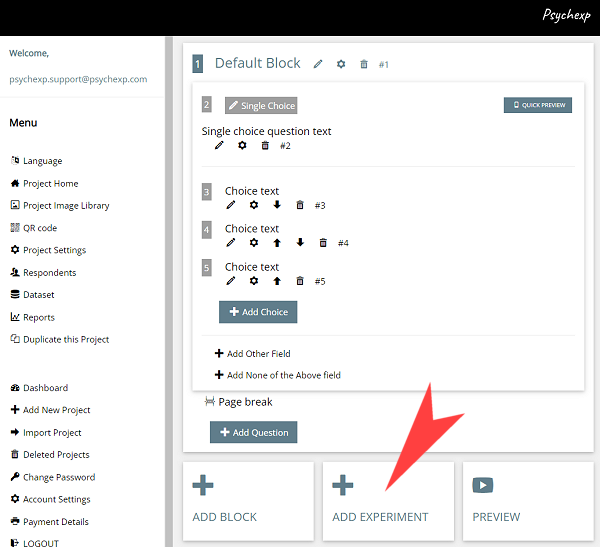
After you have made changes to the default experiment, you can see a live preview of the experiment by clicking the "Preview" button at the bottom of the page. You can preview the project as many times as you want. The preview screens are identical to the screens your participants will see when you distribute your project, however the data from a preview is not saved in the dataset.